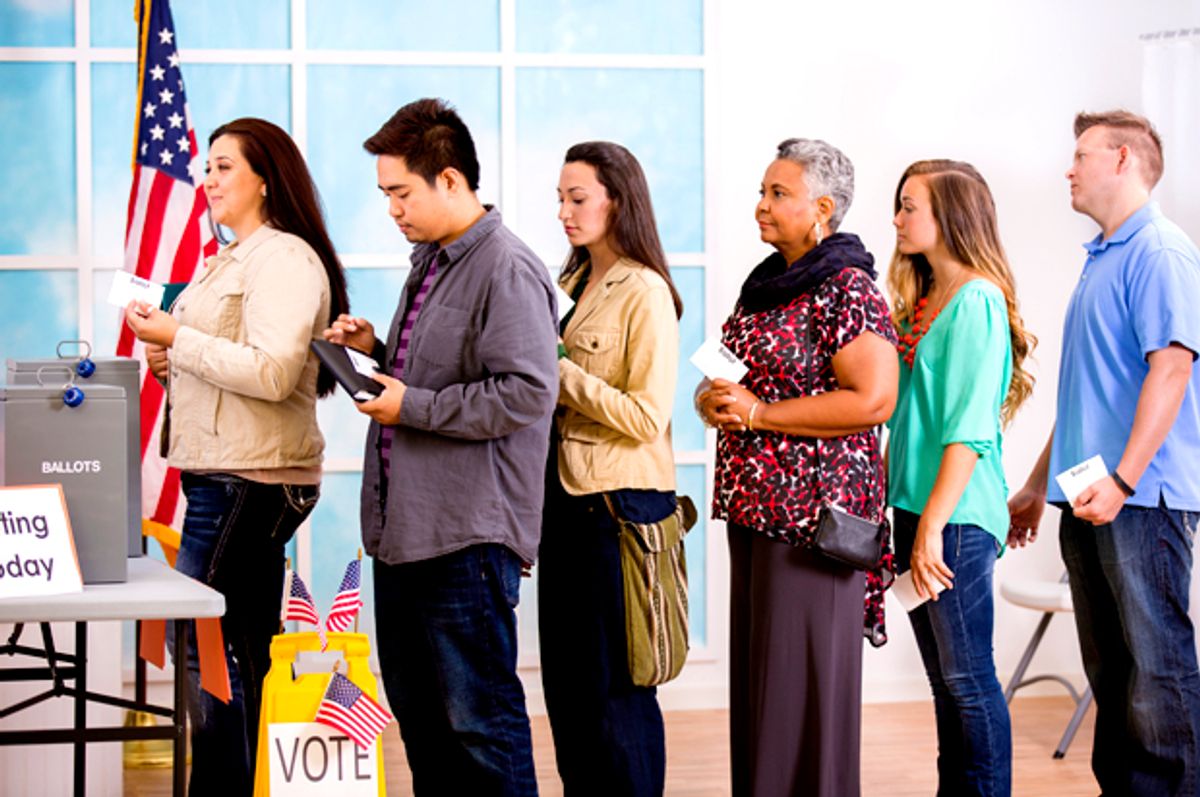
Though the election that shocked the pundits is now six months behind us, the data necessary to determine what exactly caused Donald Trump’s victory is still trickling out. Preliminary analysis completed by me along with leading turnout scholars Brian Schaffner, Jesse Rhodes and Bernard Fraga showed that turnout among African-Americans dropped in 2016, while Latino, Asian and white turnout increased. This week, the Census Bureau released new data on voter turnout that can help observers ferret out what happened. The Census Bureau’s data is a valuable source for understanding voter turnout, but should not be considered the final story. For instance, it suggests a decline in Latino turnout, which is at odds with voter file data. What we can know for sure is that stratified, inequitable turnout is distorting American democracy.
What Happened in 2016?
Though much changed in 2016, many things remained familiar. The electorate remained deeply stratified across race, age, education and income. Even though these disparities tend to be lower in high-turnout presidential elections, they are still disturbingly high. According to census data, in the 2016 election, 73 percent of whites over 65 voted, compared to 34 percent of Latinos aged 18 to 24. Among those 65 or older with an income of $100,000 or more, 87 percent voted, compared to only 34 percent of those aged 18 to 24 with an income less than $30,000.
The chart below shows turnout rates across family income for 2012 and 2016. Turnout remains deeply stratified by income, with less than half of people with incomes below $30,000 voting, compared with 80 percent of those with an income of $150,000 or greater. This has important implications: Research suggests that higher class bias in voter turnout leads to higher economic inequality and less spending on benefits for low-income people.

Can We Say Anything about Vote Suppression?
Voter suppression is a key factor in American elections, and when we discuss its impacts, it’s important to contextualize what we are talking about. For instance, there is reasonable evidence that voter ID laws reduced turnout in Wisconsin, though it’s difficult to say by how much. (See here for a review of the scholarly evidence, and here for the best study of voter ID laws.) It’s important to understand that new laws implemented between 2012 and 2016 are one part of the broader suppression story.
[jwplayer file="http://media.salon.com/2017/05/5afbbef8f853d546e6d7d7d8cf80a1041.mp4" image="http://media.salon.com/2017/05/b2afe3ccab7e7b1e6ee7cae1dcad8d88_11.jpg][/jwplayer]
For instance, voter registration deadlines that close weeks before the election also disenfranchise millions of voters. As David Shor of Civis Analytics notes, turnout among people of color in Oregon increased by 89 percent between 2012 and 2016, after the state implemented automatic voter registration (a reform that automatically registers qualified voters when interacting with some state agencies). Other research suggests that automatic voter registration bolstered turnout among young people and people of color in Oregon.
Research on the impacts of same-day registration (which lets people register on the day they are voting) and looser registration deadlines confirms that registration is a huge barrier to turnout. According to the Cooperative Congressional Election Study, in 2012 and 2016 registration was the most frequently cited reason for not voting. A third of non-voters in 2016 said they did not vote because they were not registered. Yet even in blue states like New York, automatic voter registration languishes. In Illinois, a Republican governor vetoed a bill supported by bipartisan majorities in the state legislature that would have introduced automatic voter registration to the state. In New Mexico, a centrist Democrat has repeatedly stopped such voting reforms from coming to the floor of the state legislature.
In addition to registration barriers, millions of Americans are permanently disenfranchised due to prior felony convictions, a large enough number to swing many close House elections. There has been notable progress; Virginia Gov. Terry McAuliffe deserves credit for personally re-enfranchising hundreds of thousands of voters. But here again, some blue states have yet to take progressive action; Delaware, for instance, still permanently disenfranchises some people. When we talk about “voter suppression,” it’s tempting to examine only the most recent laws, rather than embedded structures in American politics designed to entrench power for wealthy, white and older voters.
Turnout Matters -- Big Time
As I have argued in numerous reports, there is strong evidence that turnout patterns influence important policy outcomes, in addition to election outcomes. Indeed, if 2012 turnout patterns had held up, Hillary Clinton would have won the election. According to the CCES survey, voters preferred Clinton to Trump by a margin of 48 percent to 46 percent. However, non-voters preferred Clinton 49 percent to 31 percent. (Non-voters were also more likely to prefer Gary Johnson and other third-party candidates.)
These numbers should be taken with some caution, since the CCES has not yet been validated by matching individuals to voter files, but they are in line with other evidence that those who stay home lean Democratic.. The Census Bureau data show that turnout in the United States is deeply stratified by race, class, gender and age. America remains an imperfect democracy, with suppression baked into the system from onerous registration barriers and racially biased voter purges to the outright disenfranchisement of millions of Americans. Higher turnout would help remedy deep disparities in representation. It should be the central project of progressives and reformers.


Shares