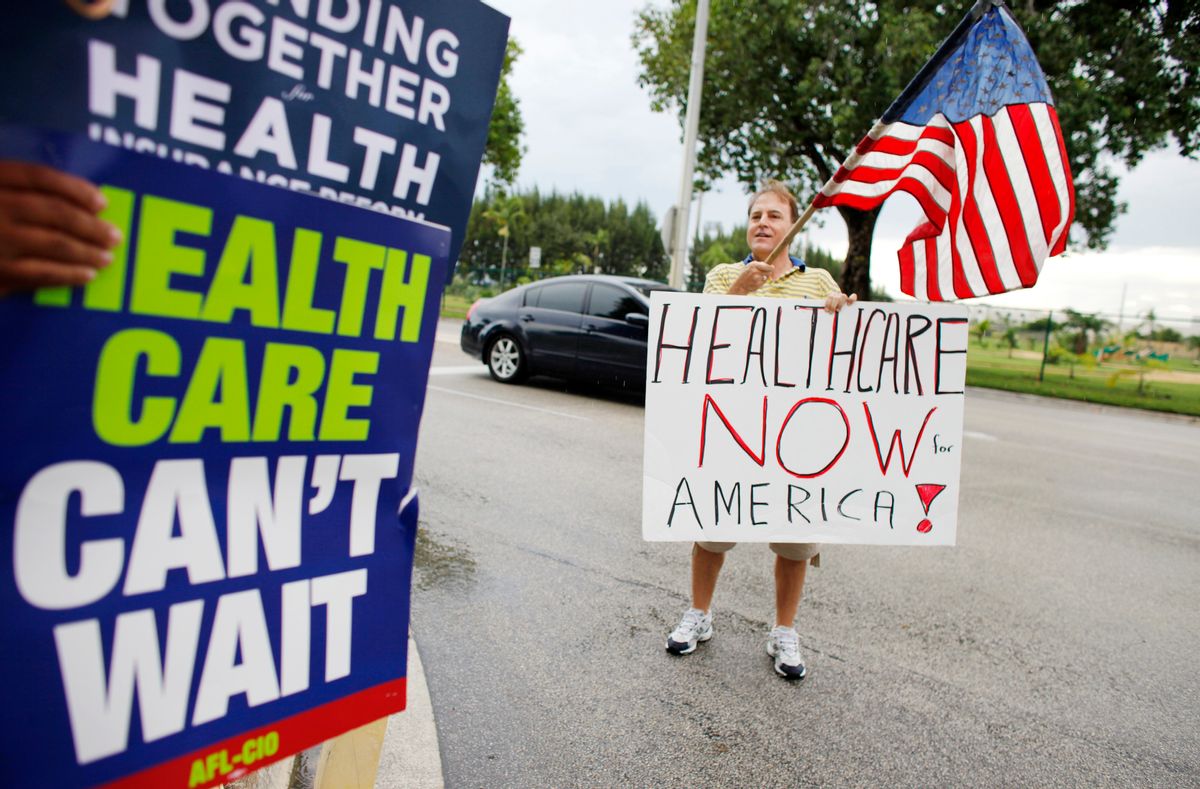
President Obama is set to address Congress to try to haul healthcare reform from the thicket it’s caught in. Presumably, he’ll seek to remind elected officials -- and more important, perhaps, viewers at home -- of just how bad it is out there, and how important it is that reform not be allowed to die yet again.
As a reference guide for those watching the end stages of the president’s toughest fight, Salon has gathered some of the key statistics. Obviously, healthcare, and its associated economic and policy debates, have complexity far beyond what a list of statistics can show. Still, the following data, ranging from insurance coverage to public opinion to legislative politics to health outcomes, paint a fair picture of the state of medicine in America.
Insurance coverage
Americans insured through employer (2007): 159,311,384 (53.4 percent)
Americans insured individually (2007): 14,541,782 (4.9 percent)
Americans insured through Medicaid (2007): 39,296,423 (13.2 percent)
Americans insured through Medicare (2007): 36,155,452 (12.1 percent)
Americans otherwise on public insurance (2007): 3,253,122 (1.1 percent)
Americans uninsured: 45,657,193 (15.3 percent)
(Source: Kaiser Family Foundation)
Americans uninsured at the time of President Clinton’s reform proposal: Approximately 37 million
(Source: Fox News)
Number of health insurance company mergers in past 13 years: Over 400
Percentage of state health insurance markets that are "highly concentrated" under Department of Justice guidelines: 94
Percentage increase in profits at 10 of the country's largest insurers, 2000 to 2007: 428
(Source: Health Care for Americans Now)
Political landscape
Democratic senators for a public option: 45
Democratic senators against a public option: 1
Democratic senators open to a deal: 13
Vacancies: 1
Republican senators against a public option: 38
Republican senators for a public option: 0
Republican senators open to a deal: 2
(Sources: Open Left; Wall Street Journal)
Percentage of poll respondents in favor of “President Obama’s plan to reform healthcare”: 48
Percentage in opposition: 51
Percentage who believe that problems with healthcare system “will eventually affect most Americans”: 65
Percentage who think most Americans “will continue to get good care”: 32
Percentage who would “feel more secure” with current healthcare system: 52
Percentage who would “feel more secure” with President Obama’s proposal: 44
Percentage in favor of “a public health insurance option administered by the federal government that would compete with plans offered by private health insurance companies”: 55
Percentage opposed: 41
(Source: CNN)
Amount spent by the healthcare industry daily on lobbying: At least $1.4 million
(Source: Washington Post)
Health spending and outcomes
Average health insurance premium for family coverage in 1999: $5,791
Average health insurance premium for family coverage in 2008: $12,680
(Source: Kaiser Family Foundation)
National per capita spending on healthcare, 2007
- United States: $7,290
- Norway: $4,763
- Switzerland: $4,417
- Luxembourg: $4,162
- Canada: $3,895
- Austria: $3,761
- France: $3,601
- Germany: $3,588
- Netherlands: $3,527
- Belgium: $3,462
- OECD average: $2,964
Life expectancy for these nations, 2006
- United States: 78.1
- Norway: 80.6
- Switzerland: 81.7
- Luxembourg: 79.4
- Canada: 80.7
- Austria: 79.9
- France: 80.7
- Germany: 79.8
- Netherlands: 79.8
- Belgium: 79.5
Number of practicing physicians in these nations, per 1,000 people, 2007
- United States: 2.43
- Norway: 3.86
- Switzerland: 3.85
- Luxembourg: 2.87
- Canada: 2.18
- Austria: 3.75
- France: 3.37
- Germany: 3.50
- Netherlands: 3.93
- Belgium: 4.03
Percentage of population classified as obese, 2006
- United States: 34.3
- Norway: 9.0 (2005)
- Switzerland: 8.1 (2007)
- Luxembourg: 20.4
- Canada: 15.4 (2007)
- Austria: 12.4
- France: 10.5
- Germany: 13.6 (2005)
- Netherlands: 11.3
- Belgium: 12.4 (2004)
Diabetes deaths per 100,000 people, 2005
- United States: 20.3
- Norway: 10.1
- Switzerland: 10.8
- Luxembourg: 7.4
- Canada: 18.4 (2004)
- Austria: 27.1
- France: 10.9
- Germany: 16.2
- Netherlands: 15.8
- Belgium: 15.1 (1999)
Cancer deaths per 100,000 people, 2005
- United States: 157.9
- Norway: 159.4
- Switzerland: 138.7
- Luxembourg: 153.9
- Canada: 169.0 (2004)
- Austria: 157.0
- France: 165.6
- Germany: 159.3
- Netherlands: 180.8
- Belgium: 183.2 (1999)
Heart attack deaths per 100,000 people, 2005
- United States: 37.9
- Norway: 49.0
- Switzerland: N/A
- Luxembourg: 35.8
- Canada: 41.5 (2004)
- Austria: 44.1
- France: 21.4
- Germany: 46.3
- Netherlands: 41.0
- Belgium: 47.7 (1999)
Infant mortality, deaths per 1,000 live births, 2006
- United States: 6.7
- Norway: 3.2
- Switzerland: 4.4
- Luxembourg: 2.5
- Canada: 5.0
- Austria: 3.6
- France: 3.8
- Germany: 3.8
- Netherlands: 4.4
- Belgium: 3.7
(Source: Organisation for Economic Co-operation and Development)
Amenable mortality rate, preventable deaths per 100,000 people, 2002-2003
- United States: 110
- Norway: 80
- Switzerland: N/A
- Luxembourg: N/A
- Canada: 77
- Austria: 84
- France: 65
- Germany: 90
- Netherlands: 82
- Belgium: N/A
(Source: The Commonwealth Fund)
Estimated number of deaths in the United States from lack of health insurance, 2006: 22,000
(Source: The Urban Institute)


Shares