Recently, Mitt Romney used a conversation he had with a firefighter as part of his campaign pitch. "I spoke with a fireman yesterday, and he has a one-bedroom apartment, and his wife is pregnant, and he can't afford a second bedroom," he told an audience in Virginia. "I asked the firefighters I was meeting with, about 15 of them, how many had had to take another job to make ends meet, and almost every one of them had."
Just because Romney is a fan of firemen doesn’t mean that firemen are fans of Romney, however: pick a random donor from the Obama and Romney campaigns, and the Obama donor is 10 times as likely to be a firefighter. How do we know this? From campaign finance disclosure data. As it turns out, campaigns must make “best efforts” to obtain the occupation and employer of anyone who contributes more than $200.
With over 500,000 contributions to the 2012 Romney and Obama campaigns, these contributions represent a lot of money ($177 million, to be exact) and a ton of fascinating data. By counting how often certain job titles appear in these disclosures, we can create a data-driven summary of the degree to which different professions support each candidate. For example, contributions to President Obama’s campaign are 80 percent more likely to be from dancers than those to Gov. Romney’s. And even though Obama enjoys nearly a 30 percent lead with physicians, surgeons favor Romney by almost 200 percent.
An important note on these figures: in the 2012 election cycle, Obama has received the lion’s share of reported contributions (445,000 vs. Romney’s 90,000), although the total amount raised via individual contributions is much closer ($100 million vs. $77 million). Therefore, the numbers in this article reflect the percentage of a candidate’s contributions associated with a particular job title, not the absolute count -- because Obama simply has a much larger sample of job titles. Additionally, while I’ve tried to match synonymous titles wherever possible, there may be a slight bias embedded in the self-reporting of titles.
Some of the conclusions drawn from this analysis confirm what we already know. First, that retirees are very active politically, accounting for about a quarter of the donations to both campaigns. Since retirees dwarf every other category, they are excluded from the graphs below. Also unsurprising is that executives and financial professionals are more likely to donate to the Romney campaign, while academics, creative professionals and workers in unionized professions favor Obama. For every contribution to Romney’s campaign, Obama receives (again, on a relative basis) 3.12 from architects, 2.65 from designers, 2.37 from those in advertising, and 1.96 from art dealers. By contrast, for every contribution to Obama’s campaign, Romney sees 16.22 from investment bankers, 4.85 from financial advisors, 3.63 from CFOs, and 3.21 from CPAs.
Let’s look at the top professions that have contributed to each campaign. We immediately notice a few interesting trends. The top three positions for both campaigns are identical, though in a slightly different order: homemakers, attorneys and physicians. The next six positions, however, are wildly different. And, in a remarkable contrast, the “not employed” make Obama’s list, while the “self-employed” make Romney’s:
[caption id="attachment_129207" align="aligncenter" width="419" caption="Credit: Benjamin Wheelock"] [/caption]
Medicine is one category that turns up some of the more skewed title-by-title results. Among those who list “doctor” or “physician” anywhere in their occupation, Obama receives 142 percent of the donations directed to Romney’s campaign on a relative basis. An insignificant number of these are “postdoctoral fellows” or the like. Even more strikingly, nurses give to Obama 617 percent more often. Yet Romney still has something to smile about: he sees, relatively, 145 percent more donations than Obama from dentists and 196 percent more from anesthesiologists. Surgeons, neurosurgeons, and podiatrists also prefer Romney, by 186 percent, 456 percent and 702 percent, respectively. Curiously, optometrists see things evenly, as do radiologists.
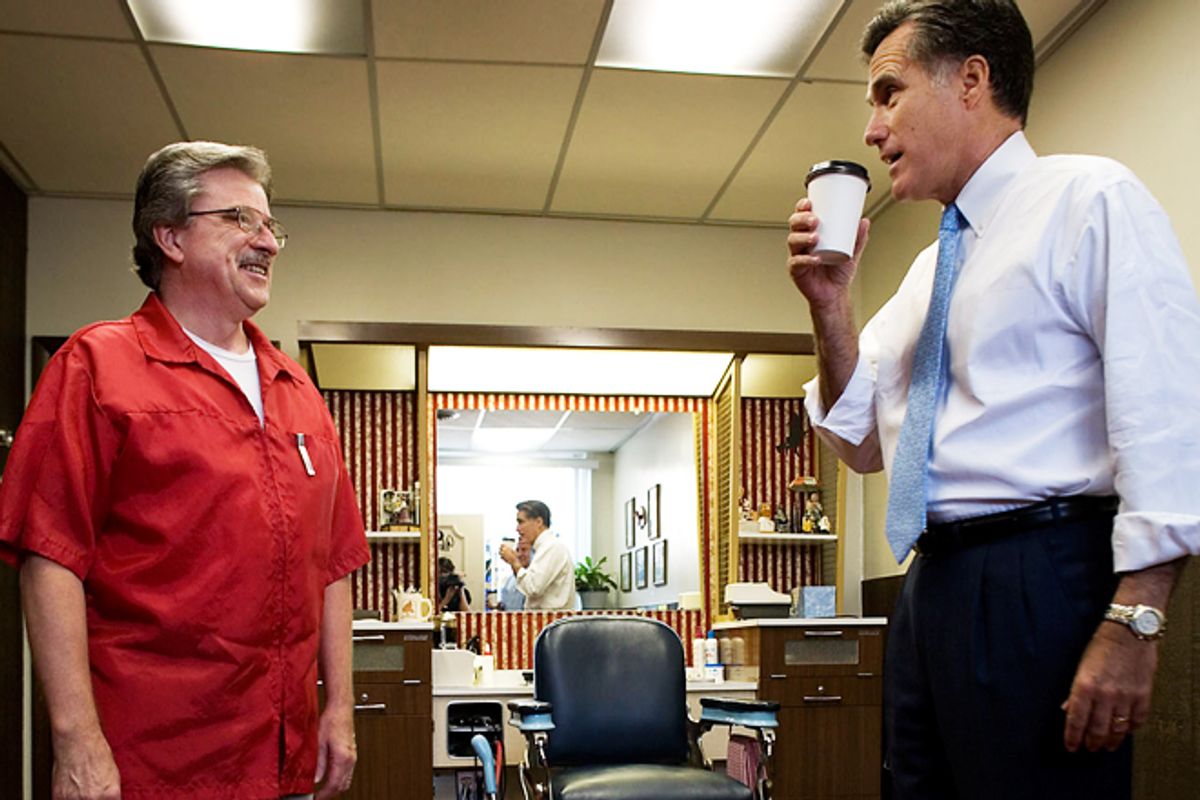
There are some specific professions that show a slight and surprising -- to me, at least -- skew. Bus drivers steer slightly toward Romney (by 32 percent), as do pilots (24 percent) and police officers (49 percent). Obama received contributions from 28 people with “Mary Kay” in their title, compared to Romney’s one. Barbers would prefer to trim Obama from the ticket ... (sorry, these puns write themselves). Some other pro-Romney professions: appraisers, locomotive engineers, jewelers and coal miners. Those favoring Obama include travel agents, truck drivers, librarians and diplomats.
[caption id="attachment_12920767" align="aligncenter" width="460" caption="Credit: Benjamin Wheelock"] [/caption]
In many cases, an entire sector skews strongly toward one candidate, yet shows some subtle differences on a more specific position-by-position basis. Across technical roles, for example, programmers, software engineers and those with “IT” in their title give to Obama about five times as frequently, while database and “Web” professionals are doubly pro-Obama. Similarly, those in academia tilt heavily toward Obama -- Romney donors are 15 percent as likely to be professors as Obama donors, although that figure jumps to 50 percent for economists and 74 percent for mathematicians. Interestingly, no philosophy or English professors gave to the Romney campaign.
If you’re interested in seeing the data for yourself, head over to the FEC website where you can download comprehensive information for President Obama and Gov. Romney. Though, if you do -- and if your job title includes the word “data” or “analyst” -- keep in mind that your peers make up a 112 percent larger share of Obama contributors.


Shares