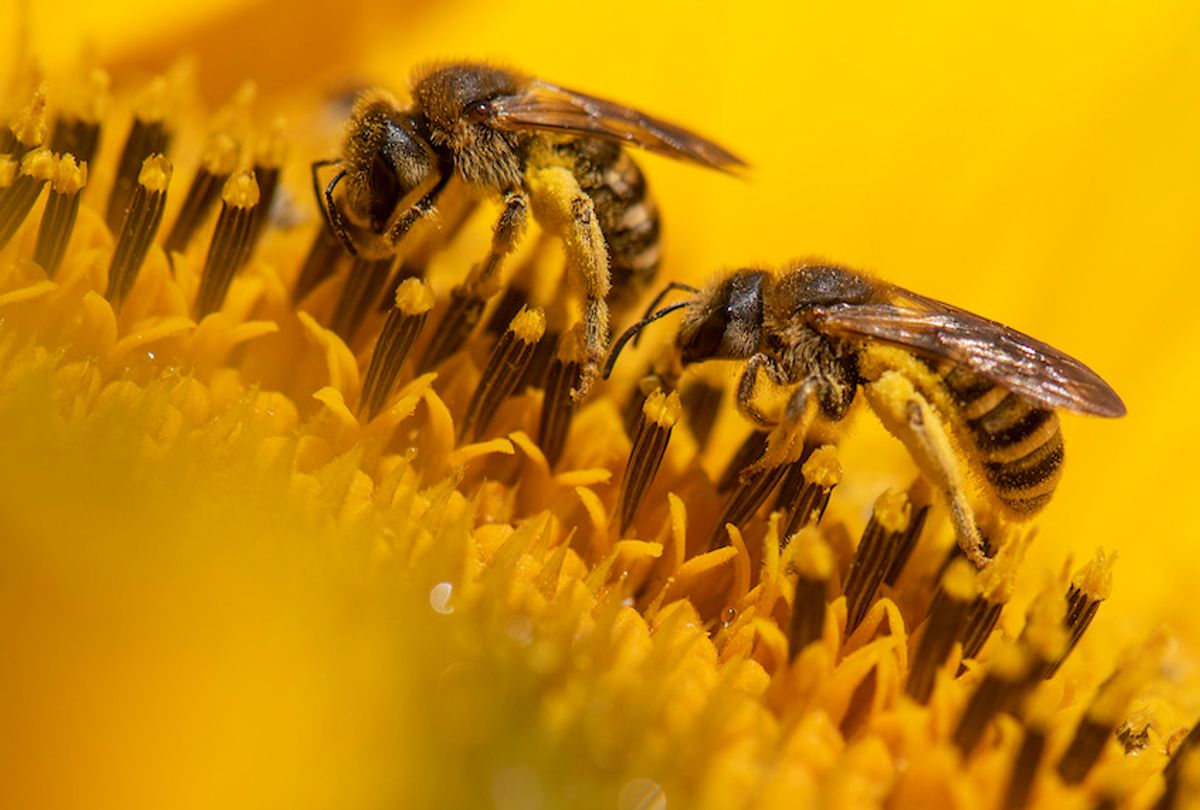
As many as five billion people will face hunger and a lack of clean water by 2050 as the warming climate disrupts pollination, freshwater, and coastal habitats, according to new research published last week in Science. People living in South Asia and Africa will bear the worst of it.
Climate activists have been telling us for a while now that global warming isn’t just about the polar bears, so it’s hardly breaking news that humans are going to suffer because nature is suffering. But what is new about this model is the degree of geographic specificity. It pinpoints the places where projected environmental losses overlap with human populations who depend on those resources and maps them with a nifty interactive viewer.
This model identifies not just the general ways climate change harms the environment and how people will feel those changes, but also where these changes will likely occur, and how significant they’ll be. It’s an unprecedented degree of detail for a global biodiversity model.
Patricia Balvanera, a professor of biodiversity at National University of Mexico who wasn’t involved in the study, said the new model “provides an extremely important tool to inform policy decisions and shape responses.”
The model looks at three specific natural systems that humans benefit from: pollination (which enables crops to grow), freshwater systems (which provide drinking water), and coastal ecosystems (which provide a buffer from storm surges and prevent erosion). Using fine-scale satellite imagery, the team of scientists mapped predicted losses to these natural systems onto human population maps. The resulting map allows you to see how many people could be impacted by environmental changes, and where.
“We were specifically trying to look at how nature is changing in delivering [a] benefit, and then where it overlaps with people’s needs,” said Rebecca Chaplin-Kramer, the lead scientist at the Natural Capital Project, a Stanford University-based research group that produced the study.
To understand why the Natural Capital Project’s model is groundbreaking, you need to understand a little bit about past attempts to gauge how the environmental effects of climate change will impact people. It’s a pretty hard thing to do — natural processes are interconnected systems, and many of the ways that humans benefit from these natural processes (what scientists call “ecosystem services” or “nature’s contributions to humanity”) aren’t obvious.
“The real challenge, with nature’s contributions to people, is that it benefits us in so many ways that it’s sort of mind-boggling,” Chaplin-Kramer said. “It’s just so abstract that it tends to be disregarded.”
The Natural Capital Project’s model was initially intended to support the massive U.N. biodiversity report released this spring. That report coalesced 15,000 scientific studies into the most comprehensive survey ever done of how climate change threatens global biodiversity — science-speak for “every living thing.” Even if you didn’t read the whole thing, you probably saw headlines like “One million species at risk of extinction, UN report warns.” The IPBES report included a 200-odd page chapter that laid out how all the different things we could see happen to nature will affect people — depending on how humanity reacts in the next few decades to the climate crisis.
But the IPBES report bumped up against one of the biggest challenges when it comes to quantifying nature’s contributions to humankind: Most occur on a local scale. “Spatial context really matters,” said Chaplin-Kramer. “It’s not just the total amount of nature we have, but where we have it, and if it’s in the place where it can deliver the most benefits to people.”
Bee pollinator habitats, for example, only provide benefits to people if they’re within a few miles of the farms that grow our food. Plants that filter nitrogen out of a stream are only “useful” for humans if they’re downstream of the pollution source and upstream of the population. So while the IPBES was able to offer lots of predictions about the aggregate consequences of biodiversity loss — e.g., food supplies will suffer as we lose habitats for bees — they weren’t able to say specifically where they’d occur.
The new model does more than illustrate a problem with great detail — the framework behind it also has the potential to be a powerful tool for avoiding the worst effects of climate change. It could help people prepare for the catastrophes it forecasts.
Unai Pascual, a lead author of the IPBES report and co-author of the Science article, sees this model as taking the IPBES report’s findings a step further, translating a conceptual framework “into something that really can be applied.”
Scientists and non-scientists alike are interested in understanding how to maximize the benefits provided by nature. Just this week a study published in Science Advances found that biologically diverse fields yielded more crops than farms practicing monoculture. Iowan farmers are finding that planting strips of land that mimic native prairies has a range of benefits. In China, a national “Ecological Redline Policy” takes ecosystem services into account in zoning decisions.
These sorts of programs will be more necessary as climate change continues to threaten ecosystems around the world, and policymakers and businesses are increasingly looking to scientists for information about how to protect the natural resources humans need most.
Chaplin-Kramer’s team is working with the World Bank to develop a “Natural Capital” index so that countries can track the condition of their natural resources. They’re also working on an optimization framework to figure out which interventions will have the greatest impact. That will help policymakers use this information to implement conservation policies in the places where, as Chaplin-Kramer put it, “you can get the most bang for your buck.”


Shares