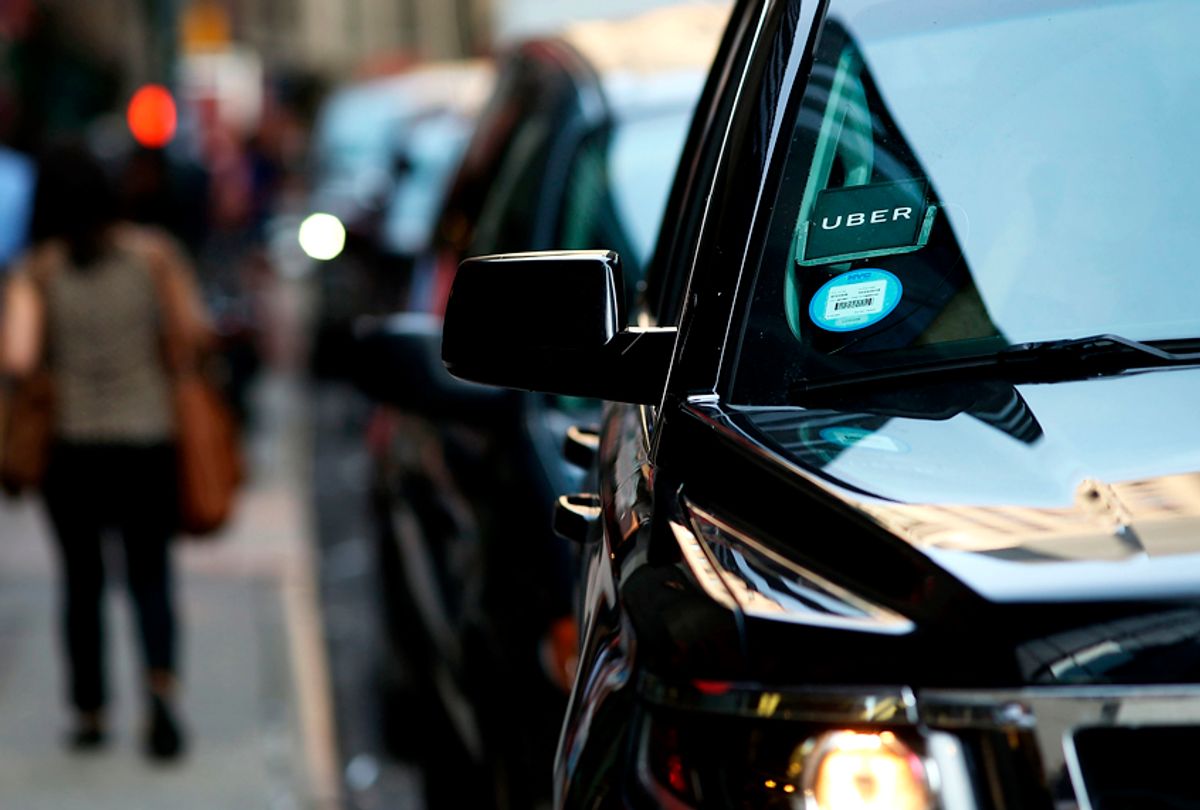
Since Uber released its first ever safety report on Dec. 5, the media has raised alarms for the 5,981 instances of sexual assault included in the document.
This also includes 464 reports of rape over a two-year period — 2017 to 2018.
Uber also reported 97 fatal car accidents and 107 total deaths during the same period.
From my perspective as a data scientist, however, the numbers may not be as alarming as some reports have claimed.
On the road
In 2018, 36,560 people lost their lives in motor vehicle fatalities in the U.S., and 58 of those deaths were Uber-related.
One might think those are the only numbers necessary to inform a decision on Uber’s safety record, but they aren’t. In order to have an accurate assessment of Uber’s motor vehicle fatality, the raw numbers must be compared to the number of miles traveled.
In 2018, Uber, when all the miles driven by all the drivers are added up, has 10.2 billion miles on the road. The national amount of miles driven in the U.S., during the same time period, in total is 3.2 trillion.
This means that the risk of dying in a motor vehicle accident as of 2018 with Uber is 0.57 deaths per 100 million miles driven, while the national risk is 1.13 deaths per 100 million miles driven.
For 2017, the U.S. Department of Transportation reported 1.16 deaths per 100 million miles driven for all motor vehicles.
This data implies that it is safer to drive in an Uber than your own car. There is no existing data for taxis.
There are many different reasons this could be true, including fewer drunk Uber drivers versus individual drivers and Uber drivers having more experience driving than an individual driver.
What about sexual assaults?
Uber reported 3,045 instances of sexual assaults in 2018, including everything from nonconsensual kissing to nonconsensual sexual penetration.
That raw number is shocking, and even one case of sexual assault is one too many. But do those numbers say that Uber is less safe than any other form of transportation?
In this case, Uber was responsible for over 1.3 billion rides that year, meaning the chance of being sexually assaulted in an Uber was 0.0002%.
In order to compare the safety of Uber to yellow cabs and other vehicles, researchers would need to know the number of reported sexual assaults for all types of transportation vehicles.
That data does not exist for the United States. However, it does exist for London, where Uber was banned in 2017 due to “a lack of corporate social responsibility.”
In 2016, there were 154 allegations of rape or sexual assault in London made to the police where the suspect was alleged to be a taxi driver — this includes Hackney cabs and Ubers. Uber drivers were allegedly involved in 32.
So Uber drivers are responsible for about 20% of the sexual assaults by taxi drivers.
Crunching the numbers
Is that number disproportionately high or low compared to the number of journeys?
According to the Transport for London office, every week there were two to three million journeys in all kinds of taxis, including Uber. Uber in London accounted for more than a million in 2016.
So Uber was responsible for over 30% of the journeys, but only 20% of the sexual assaults, meaning that there is no reason to believe that Uber drivers are any more dangerous then any other kind of taxi driver. Actually, quite the opposite.
In June 2018, the Magistrates’ Court overturned the ban on Uber, giving the company a 15-month probationary license. But in November, Uber was again banned in London due to alleged “repeated safety failures.”
While any sexual assault is one too many and one can never diminish the seriousness of these issues, critics need to take a closer look at the statistics to make a truly informed decision about Uber’s safety.
Liberty Vittert, Professor of the Practice of Data Science, Washington University in St Louis
This article is republished from The Conversation under a Creative Commons license.


Shares